Unified Modelling Language
The following materials are derived from the UML lecture. The video lecture is included at the bottom of the document.
What is UML?
UML is a visual notation system which can be used to design software. It was first devised in 1996 by Booch, Jacobson and Rumbaugh. The goal was to unify/standardise all the various modelling languages and diagrams used in Software Development. In 2005, ISO published UML as an international standard. UML 2.0 is the most current version, with 14 different diagram types defined as being part of UML.
 fig.1 - Booch, Jacobson and Rimbaugh, the devisors of UML
Why use UML?
- UML offers us a standardised way of designing software
- It allows us to think through our systems before committing them to code
- It offers a shared language between programmer and other disciplines including clients
Diagram Families
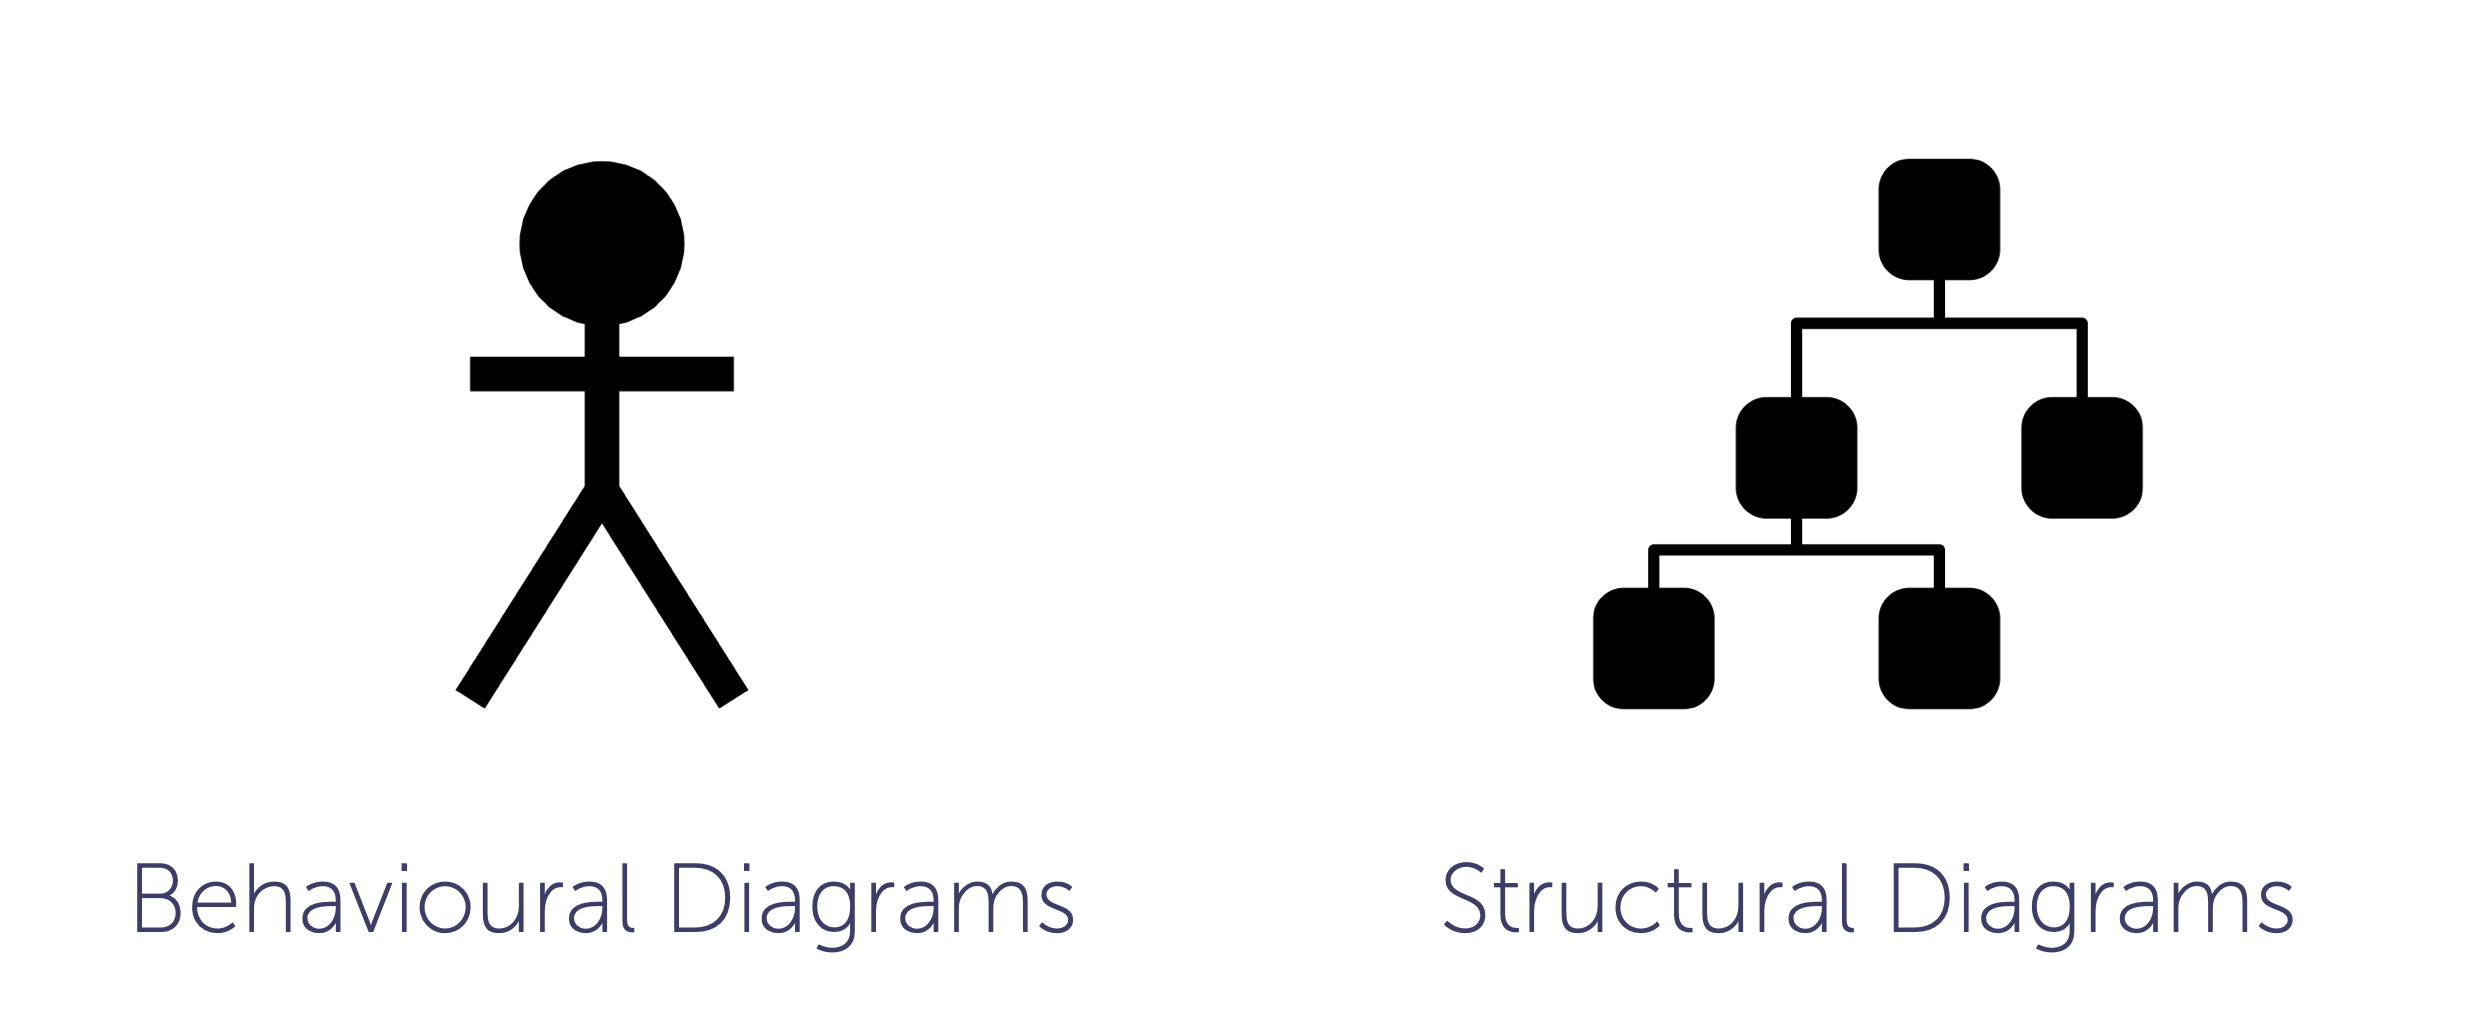 fig.2 - UML types
UML can be divided into 2 types:
-
Behaviour Diagrams – Describes what happens in a system, this includes interactions between users and the system – Or the current system and other external systems
-
Structure Diagrams – Describes what is contained in the system – Typically used to model the system
The Complete list of UML diagram types
| Behavioural | Structural |
|---|---|
| Use Case | Class |
| Activity | Component |
| State | Deployment |
| Sequence | Object |
| Communication | Package |
| Interaction Overview | Profile |
| Timing | Composite Structure |
The ones in bold are the diagrams we are going to explore during the lecture. They constitute the diagrams you will find the most useful in COMP140. But feel free to do further research into the other types.
Behavioural Diagrams
1. Use Case Diagram
Use Case diagrams typically details the user’s interaction with the system. In essence it details the Use Case of the System and the Actors which interact with the system
Note - These Actors could be other systems!
- Created using terms that a layperson could understand
- Can be used to capture and communicate User Requirements
- This is often the first diagram created for a system
- An attempt to represent the key features of a system and it’s goals.
 fig.3 - Use Case Diagram - Banking App
The above diagram describes as system for a mobile banking app.
- The bounding box describes everything contained within the system and outside it are the actors which are the customer or user and the bank itself (which could equally refer to an employee or the system itself).
- In the ellipses we have the features of the system - Login, Check Balance etc.
- The lines connecting them represent interactions between the actors and the system and are called associations.
- Finally a line with an arrow signifies a generalisation which denotes a parent/child relationship. Tne arrow always points towards the parent.
Include and Extend
The extend relationships are important because they show optional functionality or system behaviour. The <<extend>>
relationship is used to include optional behavior from an extending use case. Whereas an <<include>> use case includes the functionality described in another use case as a part of its business process flow.
 fig.4 - Include and Extend
In the above example Barney includes a noise when he burps but he can choose to extend the process by saying “excuse me”.

fig.5 - Pokemon GO Use Case
In this example which takes Pokemon GO as a starting point. We can see a the key features of the game but we can also see how a trapping is included in a Poke Stop but catching is an extension it is dependent on a set of certain parameters being met.
I have included this third-party video which will provide you with further insight into the purpose of use-case diagrams:
fig.6 - Use Case Diagrams explained by LucidChart
2. Activity Diagram
Activity Diagrams describe behaviour composed of a collection of tasks. This is used to model the flow of work and/or data in a system. This type of diagram supports choice, iteration and concurrency. You can think of this diagram as a structured Flow Chart.
Key Diagram Symbols
 fig.7 - The main symbols in an Activity Diagram
Activity Diagrams describe how activities are coordinated to provide a service which can be at different levels of abstraction. Typically, an event needs to be achieved by some operations, particularly where the operation is intended to achieve a number of different things that require coordination, or how the events in a single use case relate to one another, in particular, use cases where activities may overlap and require coordination. It is also suitable for modeling how a collection of use cases coordinate to represent business workflows. For example the process of purchasing, distributing and recieving an online shop order.
The basic layout of an activity diagram

fig.9 - Layout of an Activity Diagram (image attribution: www.visual-paradigm.com)
The below example is a simple demonstration how a game works at the highest level. The players progression through the game is measured by this basic activity:
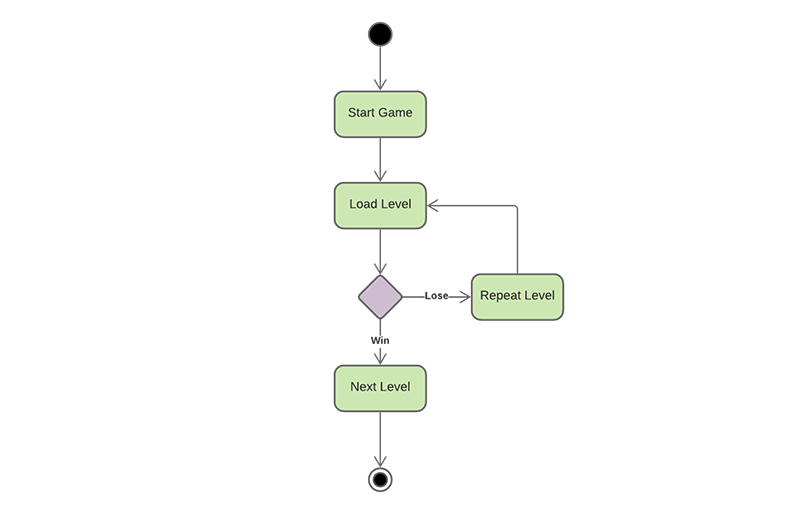 fig.10 - Top Level Game Activity Diagram
We can be more detailed and prescriptive in defining the entire game loop. This is invaluable for translating a mechanic into a logical process that can be deployed by a programmer. In the below example the game ‘Snake’ is broken into a looping procedure which defines key bindings, events and feedback.
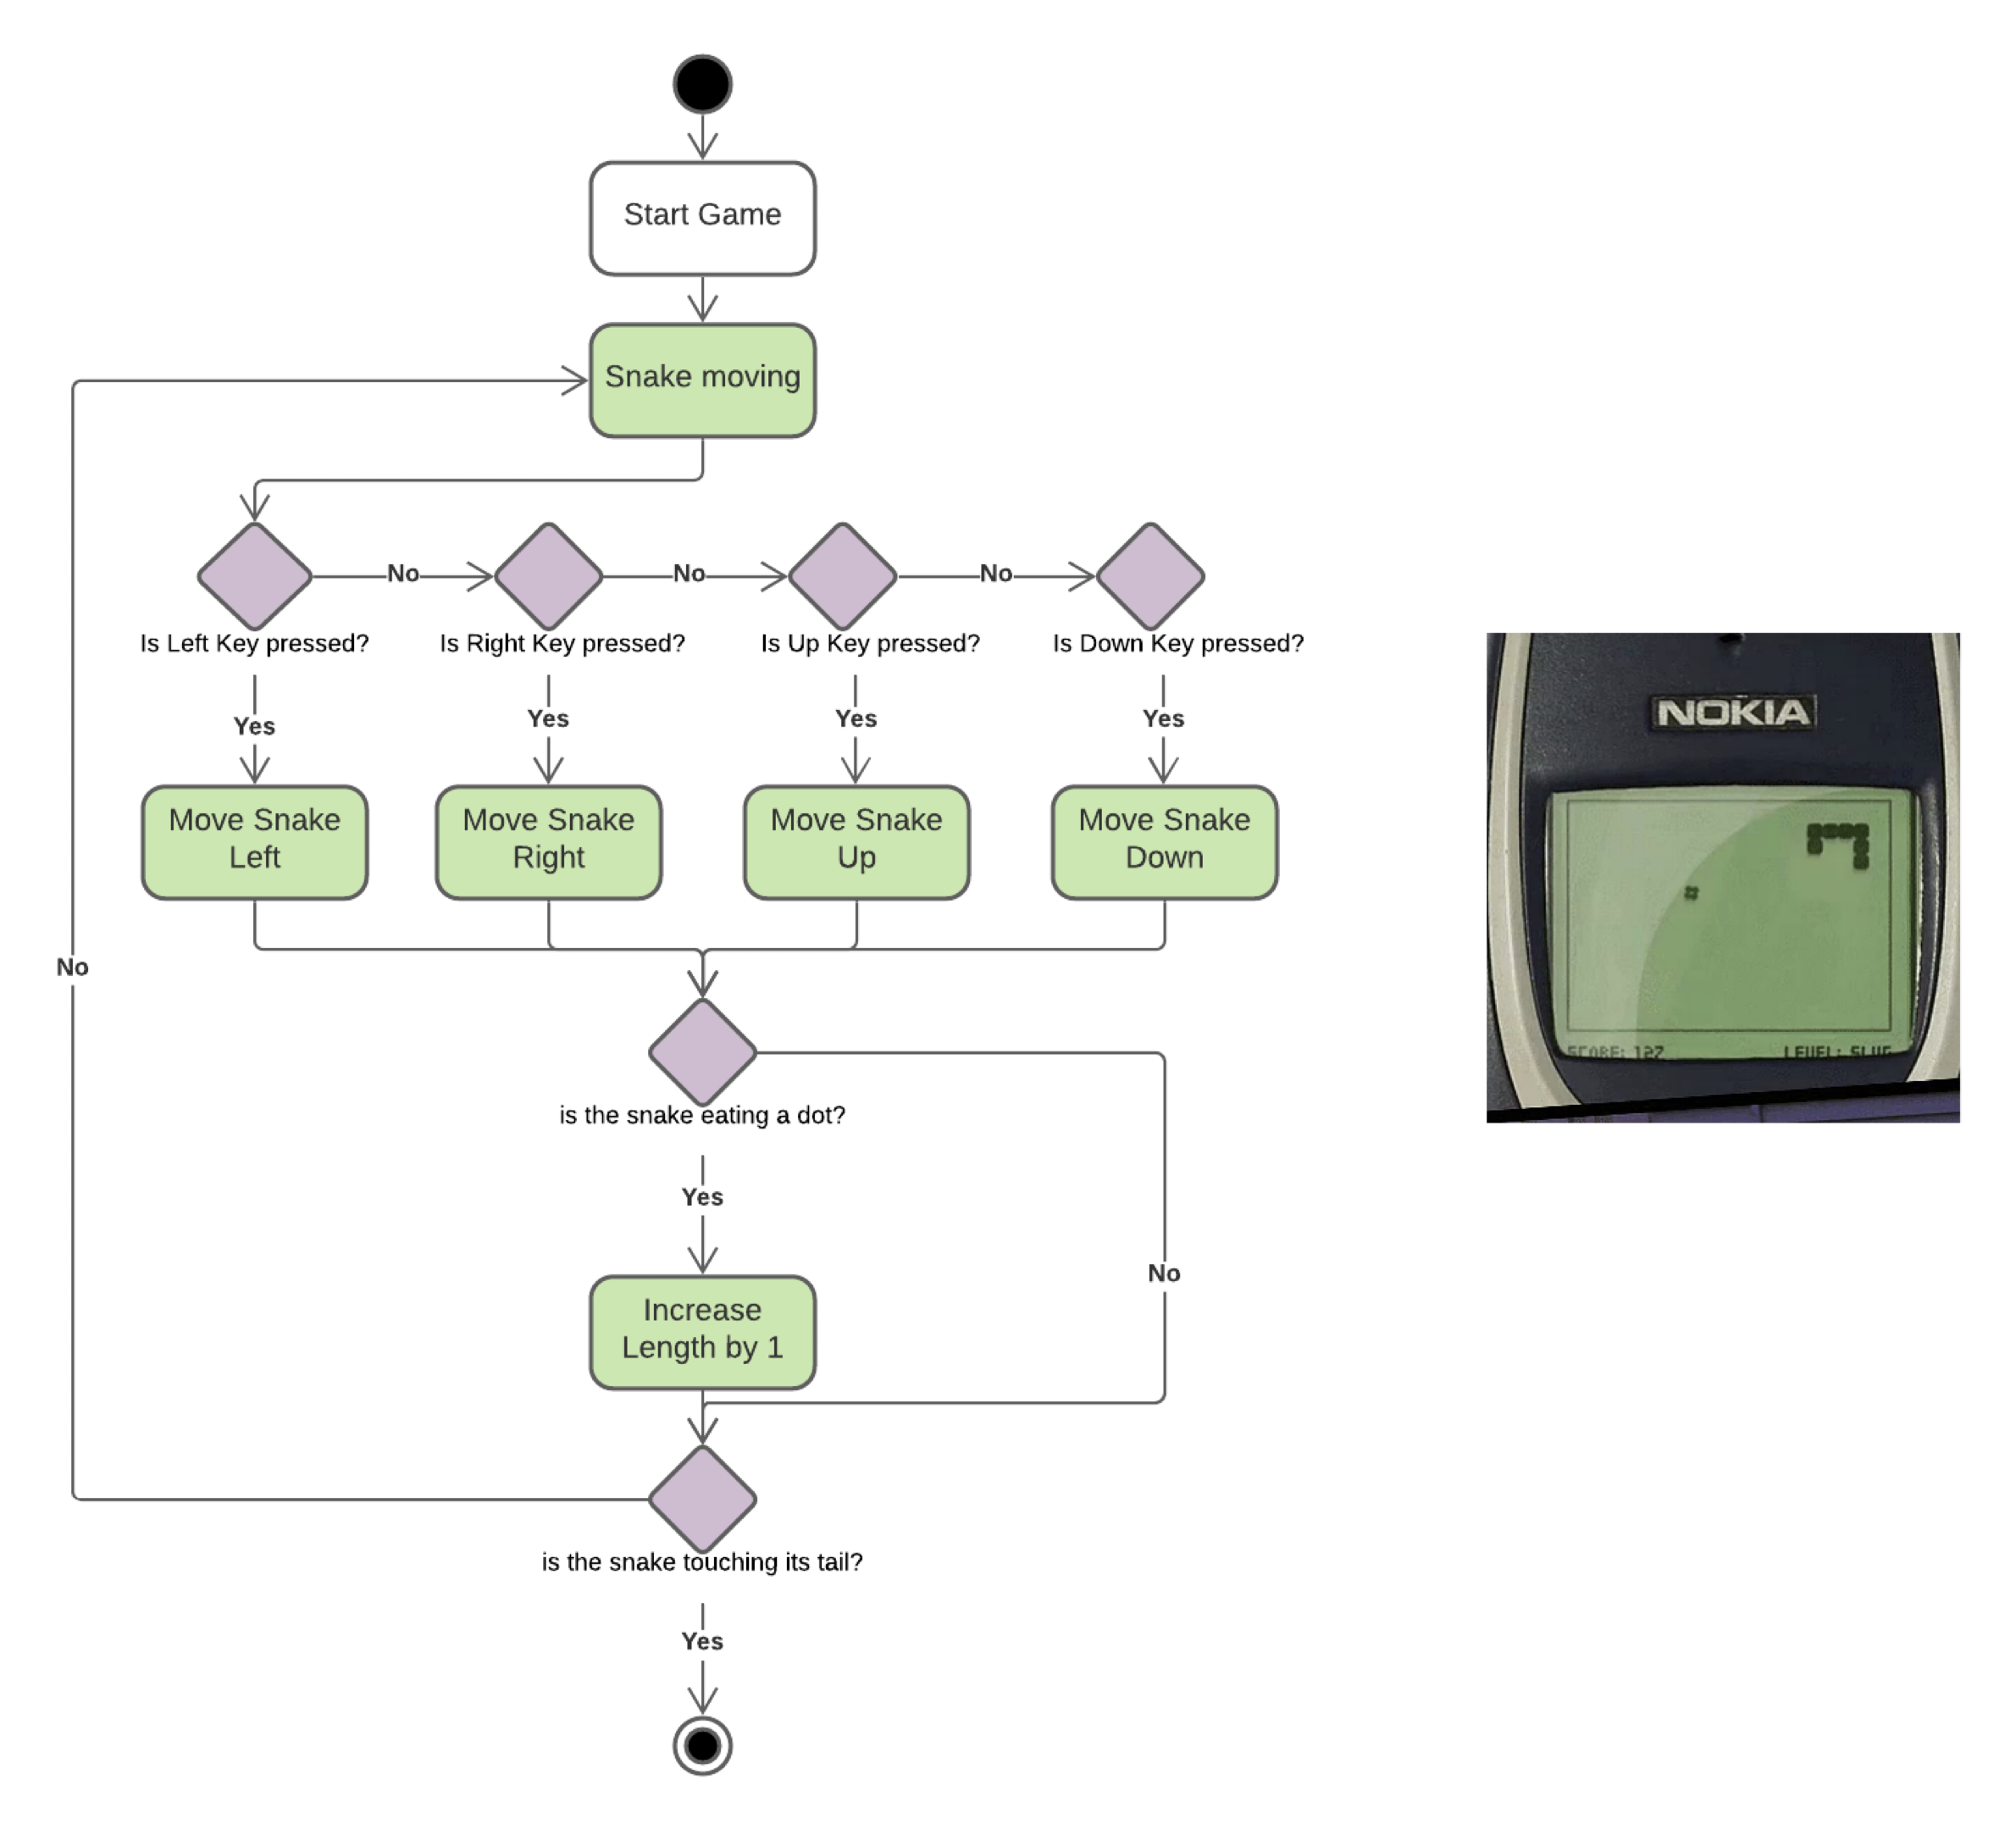 fig.11 - Nokia Classic Game ‘Snake’ as an Activity Diagram
3. State Diagram
State Diagrams are used to model the possible states of your applications. They sometimes also known as state machine diagrams. This allows you to not only to model the states but the flow of events and transitions between states. It is useful for modelling the following in games:
- AI Finite State Machines
- Game States
- Animation Systems
 fig.12 - The main symbols in a State Diagram
Below is an example of state diagram that describes an airport check-in process. We can see the use of parallel or concurrent processes with the use of a black bar:
 fig.13 - The main symbols in a State Diagram
On of the classic uses for a state diagram is to plot the various states of a character animation. It is useful a to understand how each animation cycle proceeds to others managed in a controller.
 *fig.14 - State Diagram for Character Animation*
It is also an effective method of visualising finite state machines for embedded systems. We can manage the process flow of a system. A system where particular inputs cause particular changes in state can be represented using finite state machines. This example describes the various states of a turnstile. Inserting a coin into a turnstile will unlock it, and after the turnstile has been pushed, it locks again. Inserting a coin into an unlocked turnstile, or pushing against a locked turnstile will not change its state.

fig.15 -Finite State Machine (image attribution: Wilipedia)
A state diagrams helps to represent the changes in the state of a washing machine.

fig.16 -State Machine for a Washing Machine (image attribution: www.sparxsystems.com)
4. Sequence Diagrams
UML Sequence Diagrams are interaction diagrams that detail how operations are carried out. They capture the interaction between objects in the context of a collaboration. Sequence Diagrams are time focussed and they show the order of the interaction visually by using the vertical axis of the diagram to represent time what messages are sent and when.
- This can be used to model the flow of logic in a system
- This is useful to see how the user interacts with the system
- How the data flows between different parts of the system
- These diagrams are often time focused with the vertical axis used to represent time
 fig.17 - The main symbols in a Sequence Diagram
 fig.18 - A Sequence Diagram of a game of ‘Pong’
You may find the examples above of sequence diagrams difficult to read. You can view them in more detail on Lucid Chart here.
I have included this third-party video which will provide you with further insight into the purpose of sequence diagrams:
Structural Diagrams
Class Diagrams
Class Diagrams are used to model object-orientated systems. It is the one diagram which can be directly translated into code. It has entities which represent classes with functions and variables:
- List item
- Interfaces
- Enumerations
It can also be used to model relationships between classes like:
- Dependency
- Association
- Aggregation
- Composition
- Inheritance
- Realisation/Implementation
Defining Classes
 fig.19 - Class Diagram Boxes
In the above example we can see 3 examples of the the main symbols used in a class diagram:
- The first box in the image above is a high level view of a class. A way to simply plot all the names of classes in a given system.
- The second box includes fields(variables) and the methods or operators in our class. You can see how the encapsulation of these elements is defined by the prefix (+) for public, (-) for private and (#) for protected
- The third box shows how to define an interface this is achieved by the use of a greater than or lesser than symbols in the title
<<interface>> - I have also provided some examples of the class symbols with dummy content that could be applied to a game example.
Linking Classes Together
 fig.19 - Arrows Connecting Classes
Boxes containing classes are joined by arrows which declare the relationship between the classes. Each ending to an arrow defines a specific relationship. See above for the particlar line ending you will need.
 fig.20 - Class Diagram Terms’
- Association - An enemy can have a weapon or not and it can have multiple so it’s relationship is zero to many (0..). This is known as multiplicity. Conversely a specific weapon can only have a relationship with one enemy which is *one to one, defined as (1). An association has a descripion of the relationship between the classes added to the line itself as in ‘has a’ in the example. A character has a weapon.
- Inheritance - Like a family tree a child can inherit through a tree, tracing it’s properites back to it’s originating parent.
- Implement is specific to Interfaces it means in the example that the Player implements the Jumper interface. All interfaces are preceeded by an “I” therefore it is written IJumper. For more info on when to use interfaces refer to the materials on composition in Object Oriented Programming.
 fig.21 - Class Diagram terms’
- A dependency is a relationship between two or more objects in which an object depends on the other object or objects for its implementation. If one of these objects change, the other object(s) can be impacted. The dependency relationship between two or more objects is depicted in UML using dashed arrows. In other words, when a dependency relationship exists between two or more objects, the object needs to know about the other object(s) which it depends on.
- An aggregate is the relationship of a subordinate class to its principle one. A parent child relationship. This has a relationship number. So a tank in the above example has 1 turret and 2 tracks.
- A composition is a special case of association that describes a relationship between a whole and its existential parts. Put simply, in a composition, a part can never be larger than the whole. In the example: the village is composed of villagers and a werewolf. But the villager can never contain a village.
 fig.22 - A Sequence Diagram of a game of Super Mario Brothers
The above example demonstrates how all the previous elements can be brought together to represent an entire game and it’s objects relationships.
**You may find the examples above of class diagrams difficult to read. You can view them in more detail on Lucid Chart here. Use the tabs at the bottom of the chart to switch between the examples.
Tools for making UML
- Diagram - http://www.diagram.net
- Lucid Chart - https://www.lucidchart.com
- Gliffy - http://www.gliffy.com
There are many more you can use but these are some of the best.
Many of the above options are freemium. You may have a limited number of diagrams you can make or a time limit for use. Just be aware of the pay wall when using these tools.